System Operation Breakdown
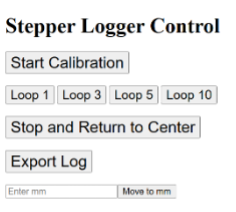
The operation of the dynamic test fixture is controlled through a custom web-based interface hosted on the Arduino, shown in Figure 25. The interface includes buttons to initiate calibration, run motion loops, stop and return to center, move to a specific position in millimeters, and export the collected data.
To begin, the user selects “Start Calibration”, which initiates a sequence to determine the full travel range of the system. Upon starting calibration, the stepper motor rotates clockwise until it triggers the minimum limit switch (A), then reverses direction and moves counterclockwise until it reaches the maximum limit switch (B). These steps are also captured from the top view in (C) and (D), respectively.
This calibration process allows the system to determine the total number of steps between the two mechanical limit stops. From this, the software calculates the center position, which is used as a reference for all subsequent motion commands. Once the center is determined, the motor automatically moves to that location (E, F). At this point, the system is calibrated and ready for operation.
After calibration, the user can select a loop command (e.g., Loop 1, Loop 3, Loop 5, Loop 10) from the website. These commands cause the system to oscillate back and forth between two defined edge positions, calculated to represent 90% of the total travel distance. This safety margin ensures the system never reaches the physical limit switches during normal operation. In addition to this, limit switch safety logic is implemented in the code: if either limit switch is triggered during normal operation (outside calibration), the system will immediately stop and return to the center to prevent mechanical damage.
The system defines the 0 mm reference point as the position where the two clamps are vertically aligned (G). Positions to the right of this reference are treated as positive, and those to the left are negative. This convention allows the software to convert between step counts and physical displacement in millimeters using the known distance between limit switches.
The web interface also includes a manual control feature that allows the user to move the platform to any desired position by entering a value in millimeters. In this case, the platform was moved to the position shown in (G) to create enough slack in the cable, allowing the top plate to be opened as shown in (H). This access is useful for installing the cable and performing any required adjustments or maintenance.
Once a loop has been completed, the user can export the recorded data by selecting the “Export Log” button. The system saves the timestamped position and force data to a connected USB flash drive, which is then used for further analysis and calculations.